Imagine driving a car with no speedometer, gas gauge, or GPS. You’d be guessing your speed, running out of fuel, and taking wrong turns. That’s what running B2B digital marketing without an analytics dashboard feels like. In 2025, data isn’t just “nice to have” – it’s your roadmap to hitting B2B marketing goals, nurturing leads, and proving ROI, as detailed in HubSpot’s insights on B2B marketing analytics. But with so many metrics, tools, and jargon, where do you start? Let’s break it down.
The 5 Metrics You Can’t Ignore in B2B Marketing Analytics
A digital marketing dashboard is only as good as the metrics you track. Here’s what to prioritize:
1. Lead Generation Health (The Pulse Check)
Are your campaigns attracting the right leads? Track:
-
Website traffic sources (e.g., organic search, LinkedIn ads).
-
Form submissions (e.g., whitepaper downloads, demo requests).
-
Lead quality scores (how well leads match your ideal customer profile).
Why it matters: If your funnel’s top is weak, even the slickest CRM software won’t save your sales team from chasing ghosts.
2. Conversion Rates (The Reality Check)
B2B sales cycles are marathons, not sprints. Monitor:
-
Email campaign click-through rates.
-
Demo-to-pipeline conversion rates.
-
Landing page bounce rates.
Why it matters: Low conversions? Your messaging might be missing the mark—like serving steak to a vegetarian.
3. Customer Retention (The Loyalty Meter)
Repeat buyers spend 67% more than new ones. Watch:
-
Churn rate (% of customers who leave).
-
Customer Lifetime Value (CLV).
-
Net Promoter Score (NPS).
Why it matters: Retention is cheaper than acquisition. Think of it as watering plants vs. buying new ones every week.
4. Revenue Attribution (The Money Tracker)
Which campaigns actually drive deals? Measure:
-
Multi-touch attribution (credit assigned to each touchpoint).
-
ROI per channel (e.g., paid ads vs. webinars).
Why it matters: Without this, you’re throwing spaghetti at the wall and calling it “strategy.”
5. Sales & Marketing Alignment (The Teamwork Gauge)
Track shared KPIs like:
-
Lead response time (minutes vs. hours).
-
Pipeline velocity (how fast leads move to closed-won).
Why it matters: Misalignment here is like a soccer team where the goalie doesn’t talk to the strikers.
How a B2B Digital Marketing Dashboard Works
Step 1: Data Collection (The Foundation)
Your dashboard pulls data from tools like CRM software, email platforms (HubSpot), ad managers (Google Ads), and social media (LinkedIn). It’s like a vacuum cleaner sucking up scattered puzzle pieces—then organizing them into a clear picture, as explained in this guide on dashboard creation.
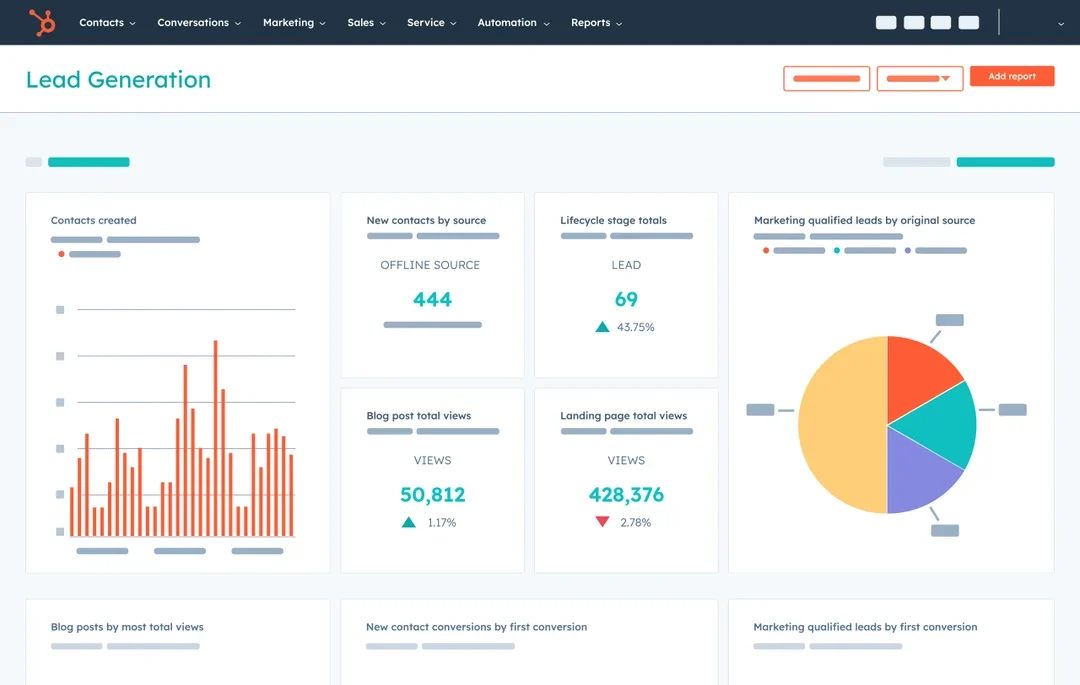
Step 2: Visualization (The “Aha!” Moment)
Raw data is overwhelming. A good dashboard turns numbers into charts, graphs, and heatmaps. For example:
-
A line graph showing monthly lead growth.
-
A pie chart breaking down traffic sources.
Pro tip: Color-code red (urgent) and green (on-track) metrics to spot fires before they spread.
Step 3: Real-Time Adjustments (The GPS Recalculation)
B2B marketing moves fast. If your webinar sign-ups drop, tweak the promo copy. If email opens plummet, test new subject lines. Dashboards let you pivot like a chef tasting soup—add salt, stir, and serve better results. Learn more about these dynamic adjustments in Salesforce’s dashboard reference.
Top Tools to Build Your B2B Marketing Analytics Dashboard
1. HubSpot Marketing Hub – Best for CRM Software Integration
Why we recommend it: HubSpot’s dashboard syncs seamlessly with its CRM, turning scattered data into a single story. Track lead sources, email performance, and deal stages without toggling tabs.
2. Salesforce B2B Marketing Analytics – Best for Customization
Why we recommend it: Salesforce lets you build dashboards as tailored as a bespoke suit. Drag-and-drop widgets, AI predictions, and account-based metrics make it ideal for enterprise teams. For more insights, check out Salesforce Ben’s coverage on B2B marketing analytics.
3. Tableau – Best for Visual Storytelling
Why we recommend it: Tableau turns complex data into eye-catching visuals (think heatmaps, funnel charts). Perfect for execs who want insights at a glance.
4. Google Analytics 4 – Best for Budget-Friendly Teams
Why we recommend it: It’s free, tracks cross-device behavior, and reveals which content drives high-value leads.
5. Zoho Analytics – Best for Automation
Why we recommend it: Zoho auto-generates reports, sends Slack alerts for KPIs, and even predicts trends—like a weather app for your marketing storms.
Read: The 5 Best CRM software for B2B in 2025
Turning Data into Decisions
A dashboard isn’t a magic wand. To hit B2B marketing goals, you need to:
-
Set clear benchmarks (e.g., “Increase demo requests by 20% in Q3”).
-
Review weekly (schedule a 15-minute “data huddle”).
-
Experiment relentlessly (A/B test everything from CTAs to landing page colors).